Solitaire FRVR Analytics #1 - The good, the bad, and the really ugly.
A major contributing factor in building successful games is good analytics. With analytics you can tell if the users are having fun, if the game is growing, if something is broken, and much more. Building games without analytics is like participating in a race with your eyes closed - you might be lucky and get to the finish line but the chances are slim.
While there is hundreds of analytics platforms built especially for games, I chose Google Analytics for FRVR games. It is by far the best analytics platform available for free, it provides great basic analytics and the event system is great for tracking game events.
It is now two weeks since Solitaire FRVR was released, let us look at the numbers.
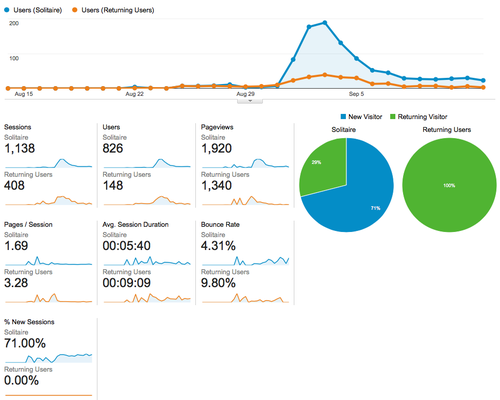
Confused? Let us see what we can learn!
Blue represent all users and orange represent returning users playing the game. The blue spike in the top graph is when the game was officially released and I spent a few days promoting the game to build the initial organic traffic.
The traffic spike is now over and the long term result can be seen - about 30 new organic users every day.
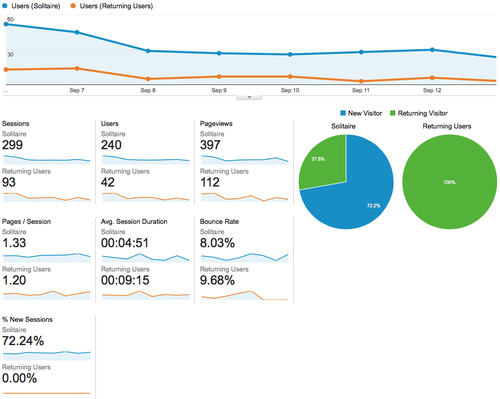
While the traffic spike looks great, the data collected during this period is not representative of the average organic traffic which is better shown by narrowing the date range to the past eight days.
Let's dive in:
Good
- The bounce rate is great with 8.03% for new users and 9.68% for returning users. What it means is that more than 90% of both new and returning users played the game.
- Returning users play for almost twice as long as new users indicating that returning users do enjoy playing the game.
Bad
- The average returning user only returned 2.21 times each. A good causal game like this should expect the average returning user return about every second day inside the first month.
- The average session length for returning users is less than then minutes.
Really Ugly
- The game is not growing! - If the game was great, users would naturally return to play over multiple days. Currently this is not the case, strongly indicating that the game is not good enough. Even worse, for the startup to be successful I need to reach at-least 100k daily active users which will be next to impossible with the current numbers.
Besides basic analytics I also added a few custom events triggers to the game.
- New Game - Counter for how many new games are started.
- Lost Game - Counter for how many times people choose new game.
- Won Game - Counter for how many times people completed the game.
For both Lost Game and Won Game I track how many seconds where played before the events triggered.
Event results from Solitaire FRVR:
- 2972 Games played in 1085 sessions (2.73 games per session).
- 1110 New games has been started via the menu.
- 140 Games have been won (4.71%).
- 440 seconds was played on average when a game was lost.
- 451 seconds was played on average when a game was won.
Conclusion
Looking at the numbers, the truthful conclusion is that the game is not doing well. The data shows no organic growth, very few engaged fans, and only 30 daily organic users.
As this is the first time I make a solitaire game I am unsure if the above event data is good and bad so no conclusions there.
So what now?
While I did not expect the game to be successful this early, it is disappointing never the less. However I strongly believe in longing at analytics data from day one. The data collected the past few weeks is the foundation I will build upon, every release from now on will be focused on improving the above numbers and slowly iterating towards a successful game.
Initially I will work on improving how many users organically return to the game by improving the game experience and making it easy for users to find the game again.