Solitaire FRVR Analytics #2 - Small steps towards greatness.
It’s been half a year since the first version of Solitaire FRVR was released, so it’s about time I update the numbers. When I last posted an Analytics Update, it was not going particularly well but I am finally happy to announce that, that has changed.
Let’s look at the user overview for the last three months¹. I choose this time range as traffic was pretty much flat before I released version 2.0 of Solitaire FRVR on January 19, 2015.
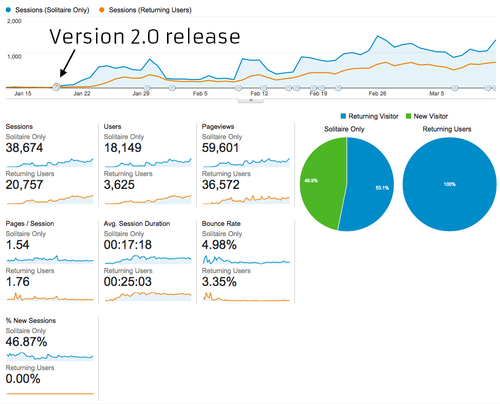
If you read my previous Analytics Update, it’s worth noticing that the scale on the graph is 10x as big from 200 to 2000. E.g. the numbers from the last update would barely show up on the graph above.
At a glance I believe it’s clear that version 2.0 was a major turning point for my hobby startup.
¹ January 13, 2015 to March 13 2015
A game worth playing
Prior to version 2.0, I had a hard time getting users to really engage with the game. Let’s compare before and after:
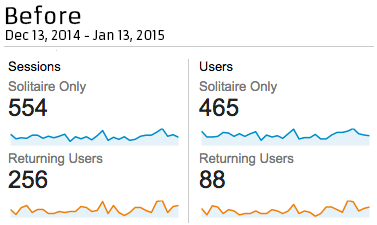
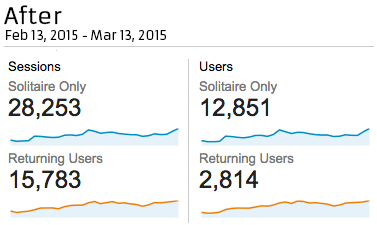
While the game has grown significantly with 501% more monthly sessions by 276% more monthly playing users, i find it more significant to look at the average user behaviour to judge potential improvements.
- Average sessions per average user
- Before: 1.19
- After: 2.18
- Improvement: 84%
- Average sessions per average returning user
- Before: 2.90
- After: 5.60
- Improvement: 93%
In short, users return to Solitaire FRVR about twice as often. Even more significant people play substantially more per session.
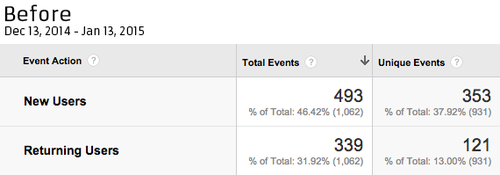
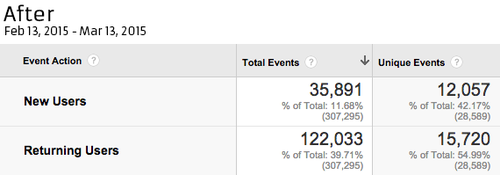
- Games played per average new user
- Before: 1.4
- After: 3.0
- Improvement: 214%
- Games played per average returning user
- Before: 2.8
- After: 7.8
- Improvement: 279%
These numbers are also reflected in average time per session.
- Average time spend per average new user
- Before: 05:10 minutes
- After: 24:54 minutes
- Improvement: 482%
- Average time spend per average returning user
- Before: 02:26 minutes
- After: 30:26 minutes
- Improvement: 1251%
All in all user engangement has improved between 84% to 1251% depending on what metric you look at. I am naturally quite happy with that.
Better users
While I would be great to attribute the increase in engagement purely to my improvements to the game, it would not be truthful. When I released version 2.0 I also started to distribute the game, putting the game in-front of users more likely to like the game.
I spend quite a lot of time using social channels to get more traffic.
- Facebook I added a like button to the game, and posted heavily on the games Facebook Page.
- 641 New users
- 1956 Sessions
- Reddit I talked extensively about the game on reddit.
- 591 New users
- 836 Sessions
- Twitter I talked extensively about the game on twitter.
- 24 New users
- 43 Sessions
I allowed the game to be embedded as an iframe on 3rd party game websites. While this might seem like fracturing my own game, there is some very good reasons to allow this, which I will reveal later! Here are the top iframe traffic sources to date.
- Superhry.cz
- 4002 New Users
- 8796 Sessions
- Minijuegos.com
- 3536 New Users
- 6096 Sessions
- Silvergames.com
- 3090 New Users
- 1761 Sessions
- Crazygames.com
- 737 New Users
- 281 Sessions
- Spelle.nl
- 500 New Users
- 253 Sessions
Lastly I build a Facebook App for the game. Not because I want users to play on Facebook, but because I wish to be able to use Facebook as a traffic source when I release the app store versions.
- Facebook App
- 630 New Users
- 2692 Sessions
I think it’s important to point out here that distribution is a continues effort. I spend proximally about 30 minutes, on average, every single day working on getting the game on front of more users. So far it’s working well.